What hardiness zone am I in?
A hardiness zone is the coldest night a place averages across thirty winters, and the USDA map draws it as half-zones of five degrees. The lookup reads that map at your own coordinates and, beside it, at the nearest station with a long record — the two are often half a zone apart, and the answer says which one you are reading.
Last updated October 15, 2026 · 5,363 stations
Nineteen half-zones, and where they occur
Every station behind the frost dates carries the USDA zone at its own coordinates. Counted, the record is lopsided: the middle of the scale holds most of the stations, the coldest half-zone in it is five stations in Alaska's interior, and the warmest is eleven stations in southern California and southern Florida.
| Zone | Average coldest night | Stations | Where they are |
|---|---|---|---|
| 1b | -55 to -50°F | 5 | Alaska (5) |
| 2a | -50 to -45°F | 13 | Alaska (13) |
| 2b | -45 to -40°F | 3 | Alaska (3) |
| 3a | -40 to -35°F | 8 | Alaska (7), Minnesota (1) |
| 3b | -35 to -30°F | 73 | Minnesota (24), Montana (23), North Dakota (16) and 4 more states |
| 4a | -30 to -25°F | 220 | North Dakota (67), Montana (48), Minnesota (37) and 10 more states |
| 4b | -25 to -20°F | 329 | South Dakota (60), Montana (59), Minnesota (42) and 14 more states |
| 5a | -20 to -15°F | 448 | Iowa (76), Nebraska (46), South Dakota (44) and 16 more states |
| 5b | -15 to -10°F | 461 | Nebraska (68), Colorado (57), Iowa (47) and 25 more states |
| 6a | -10 to -5°F | 614 | Michigan (65), Indiana (61), Colorado (51) and 28 more states |
| 6b | -5 to 0°F | 599 | Kansas (76), Missouri (61), Ohio (57) and 28 more states |
| 7a | 0 to 5°F | 601 | Kentucky (48), Virginia (41), New Mexico (40) and 29 more states |
| 7b | 5 to 10°F | 413 | Tennessee (93), Virginia (39), Oklahoma (37) and 26 more states |
| 8a | 10 to 15°F | 447 | Texas (85), North Carolina (67), Arkansas (54) and 18 more states |
| 8b | 15 to 20°F | 472 | Texas (112), Georgia (42), Mississippi (40) and 15 more states |
| 9a | 20 to 25°F | 299 | Texas (63), California (60), Florida (32) and 10 more states |
| 9b | 25 to 30°F | 234 | California (97), Texas (51), Florida (30) and 6 more states |
| 10a | 30 to 35°F | 113 | California (50), Florida (32), Texas (19) and 4 more states |
| 10b | 35 to 40°F | 11 | California (7), Florida (4) |
Counts are the 5,363 stations in this dataset, each carrying the USDA 2023 zone at its coordinates. The territories are not in the dataset, so their zones are absent from the counts rather than counted as zero. Station records generated 2026-10-16.
Where the zones fall
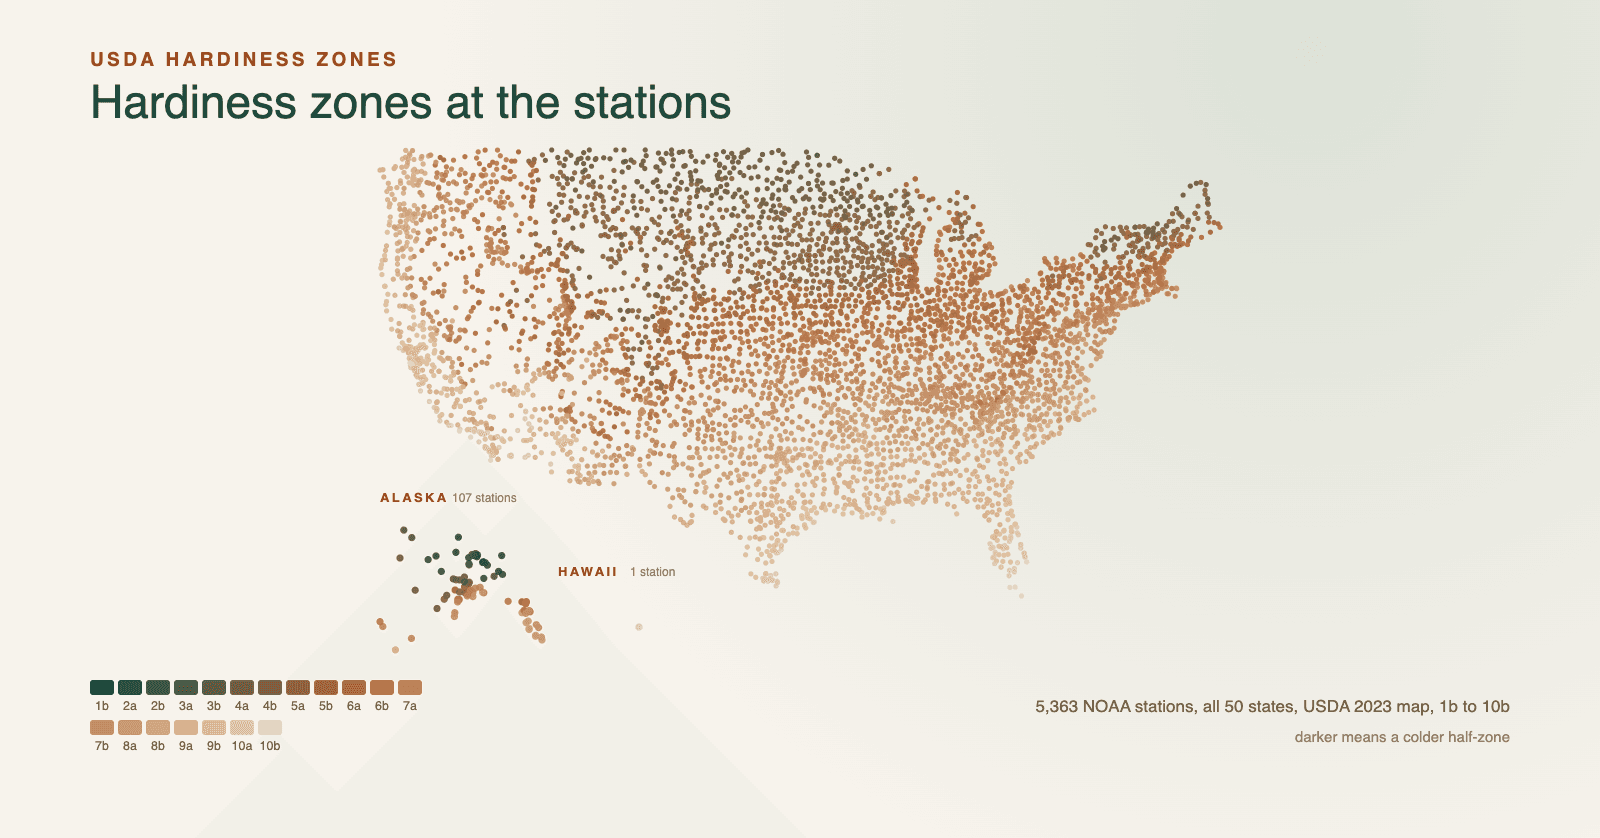
Each dot is a station, coloured by the half-zone the USDA 2023 map gives its coordinates. The bands run with latitude and elevation together, which is why a mountain valley in New Mexico can share a zone with the coast of Maine, and why Alaska and Hawaii sit as insets along the bottom of the frame.
One map, read in two places
At your coordinates, not at the station's
A ZIP code or city resolves to a point, and the point is sent to the USDA 2023 zone layer for its part of the country, which answers with the polygon it falls in. That is the same map a garden centre prints, read where you are standing rather than where the instruments are. The three layers cover the 50 states; a point outside them — Puerto Rico, Guam, a town across the Canadian border — falls back to the nearest station's zone, and the answer says so.
And at the nearest station with a long record
Beside your own zone, the answer names the zone at the station whose frost dates this site publishes, with the distance to it. The two disagree often, and the reason is rarely an error: the polygon describes the land under your point, the station describes its own ground, and forty miles inland or a thousand feet uphill is commonly half a zone. Hawaii shows the gap at its widest — the polygon over Honolulu reads 12b, while the state's one long-record station, on Kauai, reads 10a.
What a zone decides, and what it does not
The zone is the average annual extreme minimum temperature over thirty years, which is what decides whether a perennial, a shrub, or a fruit tree survives your coldest night. It says nothing about when the last spring freeze arrives: two gardens in the same half-zone can sit three weeks apart in spring, and three weeks is the difference between a crop and a replant.
The 2023 map, not the 2012 one
The USDA redrew the zones in 2023, and some places moved by half a zone or more, so two sites can both be quoting USDA and still disagree. Every figure here reads the 2023 layer, and the zone layer and the station record are both listed at the foot of the page.
A zone is a floor, not a date
The zone answers what survives your coldest night. When a seedling can go outside is the last spring freeze at the nearest station, and it moves across a single zone by weeks.
Questions the zone raises
What the numbers mean, why two sites disagree, and which question the zone does not answer.
What zone am I in?
The lookup answers with the half-zone at the coordinates your ZIP code or city resolves to, read from the USDA 2023 map. It also names the zone at the nearest station with a long record, because a station inland or uphill from you can sit half a zone colder than your own ground.
Why does another site give me a different zone?
Two reasons are common and neither is a fault. The map is one: the 2012 and 2023 USDA maps put some places in different half-zones, so a site quoting the older one is answering from an older climate. The reading point is the other: a zone taken at a nearby town, or at a weather station a county away, is the zone of that ground rather than yours.
What does 6a mean?
Zones are bands of the average coldest night of the year. Each numbered zone covers ten degrees Fahrenheit and each half-zone covers five, so 6a is an average annual extreme minimum between -10°F and -5°F. The USDA draws them from thirty years of records, which is why a zone describes a climate rather than one winter.
Does my hardiness zone tell me when to plant?
No, and this is the mistake the zone most often causes. It answers whether a plant survives the winter, not when the season opens. When tomatoes or peppers can go outside is the last spring freeze at the nearest station, and that date moves by weeks inside one half-zone.
Which zone is the coldest, and which the warmest?
In this dataset the coldest is 1b, which five stations in Alaska's interior report — Bettles, Eagle, Galena, Northway and Tanana — and the warmest is 10b, which eleven stations report and all of them sit in southern California or southern Florida. The count for each zone comes from the stations themselves, not from an estimate.
The zone comes from the USDA map and the station record from NOAA; the two readings on the answer are described above the figures.