What Zone Am I In? Find Your Last Frost Date
A ZIP code is enough to get the two answers that decide a season: your USDA plant hardiness zone, read at your own coordinates, and the average last spring and first fall freeze from the closest weather station with a long record. Two gardens in the same zone can still sit three weeks apart.
Last updated October 14, 2026 · 5,255 stations
What the dates do and do not promise
The 50% date is a coin flip
Half of the recorded years had a freeze after this date, and half had their last freeze before it. Planting to it means planting into a real risk in the years that run cold.
The safer date is the one to plant against
It comes from the coldest tenth of years in the record, so it holds in nine winters out of ten. It costs one to three weeks of season, which is cheaper than a lost round of transplants.
Hard freeze is a different number
A light freeze at 32°F nips the surface and leaves most plants alive. At 28°F the damage reaches fruit blossoms and tender stems, which is why the dataset carries both thresholds. In the warmest zones 28°F is rare enough that a station never accumulates twenty such winters, and that date is left out rather than averaged from a handful of cold years.
Where the first and last freeze land
Both maps plot the same 5,255 stations and colour each one by the date it reports: the spring map for when the season opens, the autumn map for when it closes. The colour axis runs along each season rather than between them, so tan is early and dark green is late on both.
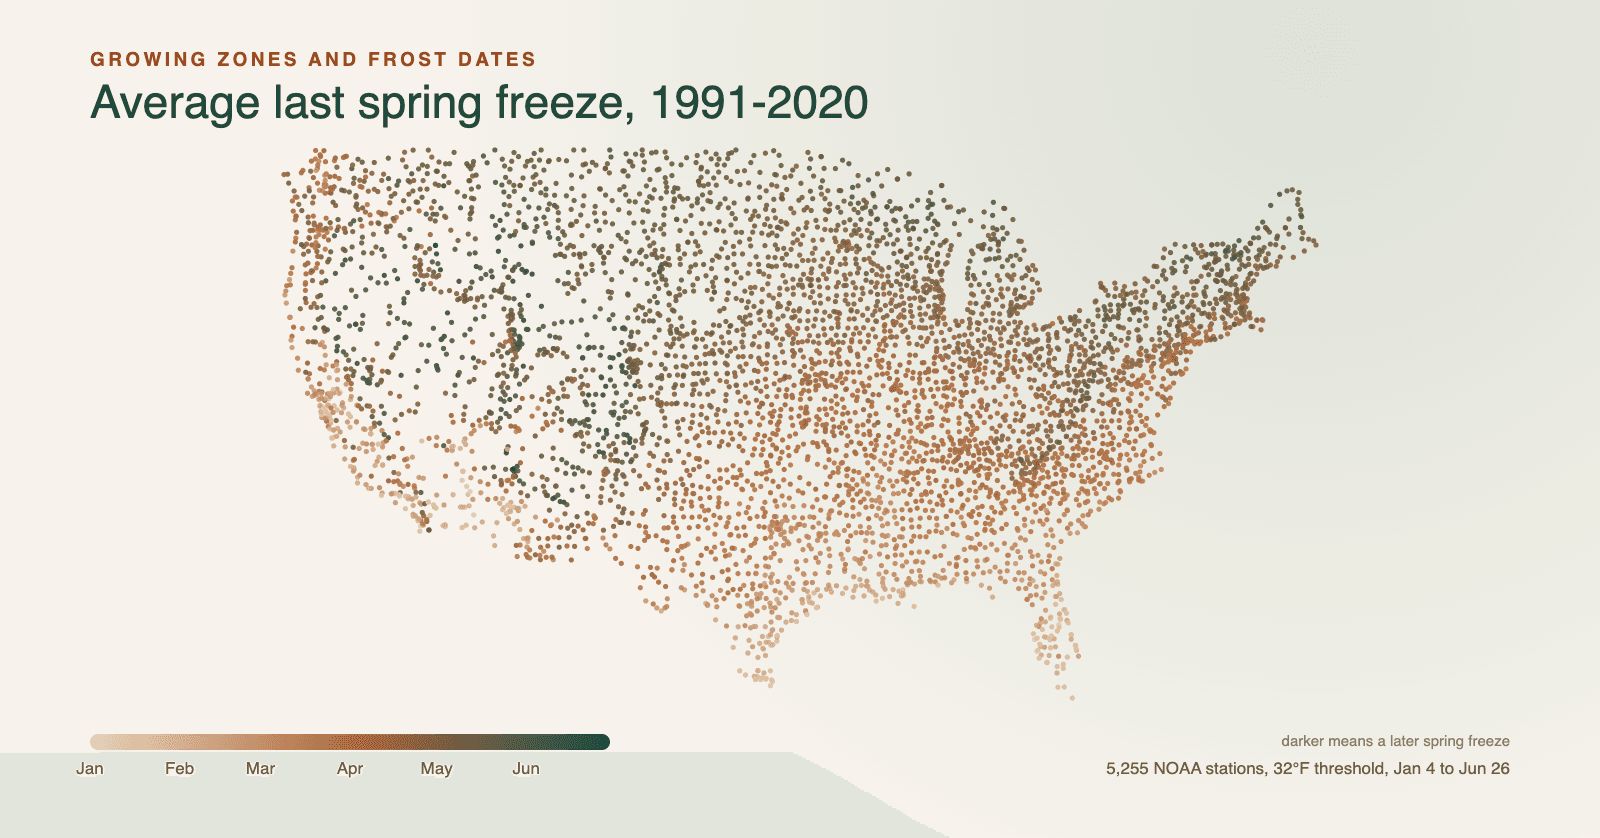
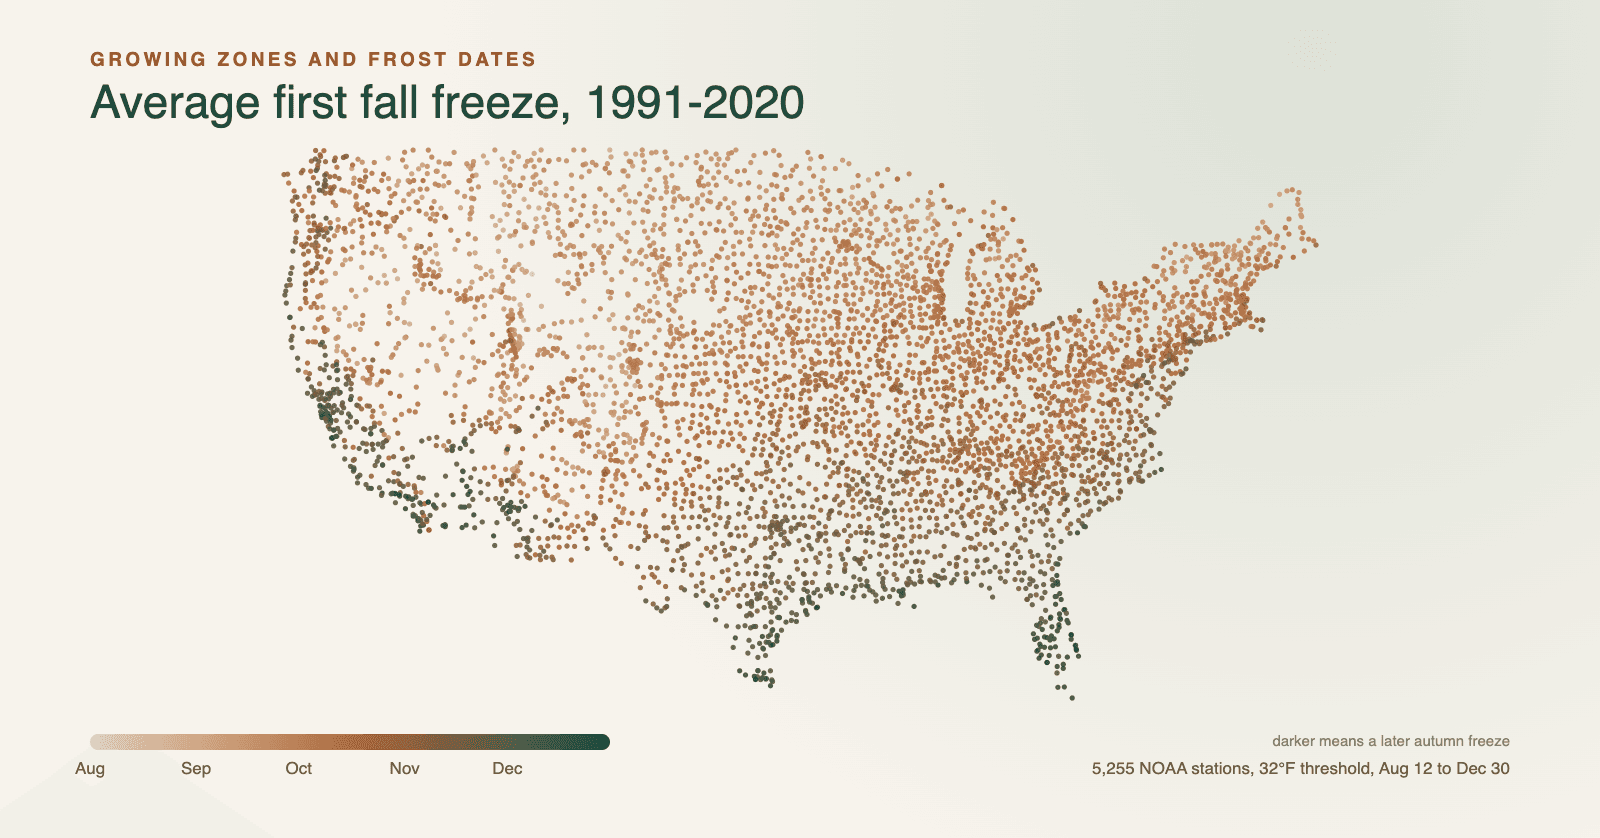
Frost dates across the states
Every station in a state gives a range rather than a date: elevation, distance from the coast, and latitude move the first and last freeze by weeks. The ranges below come from the same station records the lookup uses.
| State | Zones | Last spring freeze | First fall freeze | Stations |
|---|---|---|---|---|
| Alabama | 7b – 9b | Jan 30 – Apr 16 | Oct 21 – Dec 18 | 83 |
| Arizona | 5b – 10a | Jan 13 – Jun 24 | Aug 31 – Dec 30 | 135 |
| Arkansas | 7a – 8b | Mar 10 – Apr 15 | Oct 17 – Nov 23 | 100 |
| California | 6a – 10b | Jan 4 – Jun 16 | Sep 5 – Dec 28 | 281 |
| Colorado | 3b – 7a | Apr 18 – Jun 22 | Aug 28 – Oct 22 | 161 |
| Connecticut | 6a, 6b, 7a | Apr 6 – May 11 | Oct 5 – Nov 7 | 20 |
| Delaware | 7b, 8a | Mar 24 – Apr 12 | Oct 27 – Nov 12 | 6 |
| Florida | 8b – 10b | Jan 10 – Mar 22 | Nov 11 – Dec 30 | 99 |
| Georgia | 7a – 9b | Feb 12 – Apr 27 | Oct 17 – Dec 11 | 98 |
| Idaho | 4b – 7b | Mar 25 – Jun 22 | Aug 27 – Nov 4 | 108 |
| Illinois | 5a – 7b | Mar 25 – May 3 | Oct 2 – Nov 11 | 130 |
| Indiana | 5b – 7b | Mar 30 – Apr 30 | Oct 5 – Nov 8 | 93 |
| Iowa | 4b – 6a | Apr 6 – May 12 | Sep 23 – Oct 27 | 133 |
| Kansas | 5b – 7a | Apr 1 – May 12 | Oct 3 – Nov 3 | 150 |
| Kentucky | 6b, 7a, 7b | Mar 30 – Apr 28 | Oct 4 – Nov 2 | 60 |
| Louisiana | 8b – 10a | Jan 17 – Mar 26 | Nov 2 – Dec 29 | 73 |
| Maine | 3b – 6a | Apr 21 – Jun 8 | Sep 5 – Oct 28 | 66 |
| Maryland | 6a – 8a | Mar 20 – May 12 | Oct 7 – Nov 26 | 33 |
| Massachusetts | 5b – 7b | Apr 3 – May 14 | Sep 26 – Nov 17 | 52 |
| Michigan | 4a – 7a | Apr 14 – Jun 5 | Sep 7 – Nov 3 | 135 |
| Minnesota | 3a – 5a | Apr 20 – May 31 | Sep 10 – Oct 21 | 138 |
| Mississippi | 7b – 9a | Feb 11 – Apr 12 | Oct 22 – Dec 5 | 80 |
| Missouri | 5b – 7b | Mar 26 – Apr 28 | Oct 9 – Nov 6 | 136 |
| Montana | 3b – 6b | May 1 – Jun 18 | Aug 29 – Oct 15 | 182 |
| Nebraska | 4b – 6a | Apr 11 – Jun 5 | Sep 6 – Oct 22 | 138 |
| Nevada | 5a – 10a | Jan 20 – Jun 18 | Sep 1 – Dec 12 | 84 |
| New Hampshire | 4a – 6a | Apr 19 – Jun 3 | Sep 15 – Oct 17 | 38 |
| New Jersey | 6b – 8a | Mar 23 – May 3 | Oct 11 – Nov 20 | 38 |
| New Mexico | 5a – 8b | Mar 15 – Jun 20 | Sep 8 – Nov 14 | 146 |
| New York | 4a – 7b | Mar 27 – Jun 4 | Sep 9 – Nov 22 | 126 |
| North Carolina | 6a – 9a | Mar 4 – May 17 | Oct 4 – Dec 11 | 149 |
| North Dakota | 3b, 4a, 4b | May 2 – May 24 | Sep 16 – Oct 8 | 101 |
| Ohio | 5b – 7a | Apr 5 – May 17 | Oct 2 – Nov 15 | 109 |
| Oklahoma | 6b – 8a | Mar 20 – Apr 25 | Oct 12 – Nov 19 | 87 |
| Oregon | 5b – 9b | Feb 25 – Jun 18 | Aug 30 – Nov 30 | 135 |
| Pennsylvania | 5b – 7b | Mar 27 – May 29 | Sep 20 – Nov 26 | 121 |
| Rhode Island | 6b, 7a | Apr 10 – May 6 | Oct 9 – Nov 4 | 9 |
| South Carolina | 7b – 9a | Feb 8 – Apr 13 | Oct 22 – Dec 18 | 71 |
| South Dakota | 4a – 5b | Apr 25 – Jun 5 | Sep 6 – Oct 10 | 123 |
| Tennessee | 6a – 8a | Mar 14 – May 20 | Sep 30 – Nov 15 | 126 |
| Texas | 6b – 10a | Jan 13 – Apr 29 | Oct 13 – Dec 24 | 377 |
| Utah | 4b – 8b | Mar 2 – Jun 20 | Aug 19 – Nov 22 | 134 |
| Vermont | 4a – 5b | Apr 27 – Jun 1 | Sep 10 – Oct 18 | 33 |
| Virginia | 6a – 8b | Mar 12 – May 15 | Sep 30 – Nov 26 | 100 |
| Washington | 5b – 9a | Feb 24 – Jun 10 | Sep 7 – Nov 30 | 130 |
| West Virginia | 5b – 7a | Apr 5 – May 20 | Sep 22 – Nov 3 | 83 |
| Wisconsin | 4a – 6a | Apr 13 – May 27 | Sep 14 – Oct 24 | 151 |
| Wyoming | 3b – 5b | May 6 – Jun 26 | Aug 12 – Oct 5 | 94 |
Zones are the USDA 2023 plant hardiness zones at those stations, and the frost dates are the 50% dates averaged across the stations in the state. Station records generated 2026-10-14.
One method, stated out loud
Thirty winters of daily minimums
For each station, the last spring freeze is the latest date in the first half of the year with a daily minimum at or below freezing, taken across the 1991-2020 record. The first fall freeze is the earliest such date in the second half. A station stays in the dataset only with at least twenty usable winters behind it.
Two probabilities from one record
Sorting every year's last spring freeze gives the distribution the two dates come from: the middle year is the 50% date, and the ninth-coldest year out of ten is the safer one. The fall dates are read the same way from the other end of the year.
Zones answer a different question
A USDA zone is the average annual extreme minimum temperature over the same thirty years. It tells you which perennials survive your coldest night, and it says nothing about when your last spring freeze arrives: the same zone covers coastal and high-desert gardens with months between their planting dates.
The nearest station is not your garden
A station can sit twenty miles away and a thousand feet lower, and cold air pools in valleys that the station's ground misses. A hilltop garden, a walled courtyard, and a lake shore all run warmer than the surrounding countryside. When the answer matters, put a thermometer at the height of the plants and compare it with the nearest station for a season.
Your frost date is the floor, not the plan
Once you know the window, the next question is what is ready to go in this week. The planting calendar reads live soil temperature and the forecast for your location and answers that one.
Questions the numbers raise once you have them
What a zone decides, what a frost date does not promise, and why two sites can print different dates for the same ZIP code.
What growing zone am I in?
The lookup returns the zone for the nearest station with a long record. USDA assigns zones from the average coldest night each winter, so zone 6a means the annual low has averaged between -10°F and -5°F over thirty years. Use the zone to judge whether a perennial survives your winters, and the frost dates to decide when an annual goes outside.
How do I find my last frost date?
It comes from daily low temperatures at one station rather than from a zone. Half of the years in that station's record froze after the 50% date, and half were finished before it. The safer date is the one from the coldest tenth of years, which is what to plant against when a late freeze would cost you the crop.
Why does another site give a different frost date?
Three things move it. The probability threshold differs, so a 32°F date and a 36°F date can be a fortnight apart. The station differs, and a station in a river valley reads colder than one on the ridge above it. The years differ, because a 1981-2010 average and a 1991-2020 average are not the same climate. Ask which station and which years before treating a date as wrong.
Is frost possible at 40 degrees?
On the ground, yes. Official temperatures are measured about five feet above the soil, and on a clear, calm night the surface a few inches down is several degrees colder than the air at that height. A forecast low of 36-38°F with no wind is enough for frost on a lawn while the station reads above freezing. Wind and cloud are what stop it.
Does my last frost date tell me when to plant?
It tells you when the odds of a freeze drop, and that is the earliest a tender crop should go out. Soil temperature decides the rest: tomatoes and peppers want the soil above about 60°F, and a cold, wet week after the average date sets transplants back more than a week of waiting does. Check the forecast for the days after planting rather than the date alone.
Which places does the lookup cover?
The 48 contiguous states, from about 800 stations with long records. Alaska, Hawaii, and the territories are not in this dataset yet, so a ZIP code there will return the nearest mainland match rather than the right one.
Zones come from the USDA plant hardiness map and the station records from NOAA; the freeze method is described above the answers.